Last Update:
Automated Reports with C++

Table of Contents
Recently, I’ve written an article about using a .NET third party library to generate reports from apps. You can find it on this in my previous post. In my opinion, the whole idea might be useful, for instance, for performance tests. I often try to make such in my blog. Basically you do some tests and then output results to the console or a txt file…
But, wouldn’t it be great to write results directly to a spreadsheet and draw some charts automatically? Can it be done in C++ as well?
Introduction
In the mentioned article I’ve shown how to output test results directly to an Excel file. I’ve used there a nice library called Spire.XLS. You can easily have not only the tables, but charts as well! Moreover, if you spend some more time, there is also a possibility to calculate statistics, make predictions, calculations, etc.
This is all possible in .NET environment, here I’ve tried to apply the idea to C++ - native code.
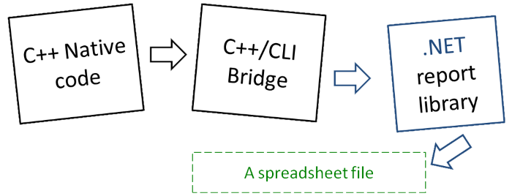
In short, we can use C++/CLI as a bridge between native and managed code.
That way, we can run our algorithms and benchmarks at full speed, with crazy native code optimizations. At the end we, simply, pass results to the reporter module. Then, we have our reports ready to analyze.
Of course another way would be to copy results from a txt file (or a console output) to a spreadsheet file. I’ve used this option often, and I must say that sometimes it wastes a lot of your time!
Managed code called from native
It is easy to call C++ from C#. All you have to do is use some kind of
PInvoke and
Interoperability
mechanisms and call a native function from managed code.
However, how can we call C# from C++? In other words: how can we use
reverse PInvoke?
Fortunately, it should be also quite easy:
- We need to create a reporter module DLL in C++ CLI.
- C++ CLI enables use to use third party library written in C# (.NET)
- From native code we can use the above DLL as ’normal DLL'.
- I’ve use this tutorial: tigerang/reverse-pinvoke
As always with interop, things gets complicated when you want to pass from one side to another (managed/native) a complex data. In my example I managed to use only simple, basic types that are handled automatically by the framework.
Implementation
Source code can be found here: github.com/fenbf/AutoPerfReport
Reporter interface: C++/CLI
#pragma once

#ifdef REPORTER_EXPORTS
    #define REPORTER_API __declspec(dllexport)
#else
    #define REPORTER_API __declspec(dllimport)
#endif

namespace reporter
{
    class REPORTER_API Reporter
    {
    private:
        class *Result _results;
    public:
        Reporter();
        ~Reporter();

        void AddResult(const char *colName, int n, double elapsedTime);
        void SaveToFile(const char *fname);
    };
}
This interface is not that generic. But for a simple tests can be
useful. For each test run you would call AddResult method with a test
name, n - size of a test case and elapsedTime.
Native code:
for (int n = startCount; n <= endCount; n += stepCount)
{
    for(auto &test : perfTests)
    {
        test->run(n);
        report.AddResult(test->name(), n, pt->elapsedTimeSec());
    }
}
Managed code:
void Reporter::AddResult(const char *colName, int n, double elapsedTime)
{
    _results->_res[colName][n] = elapsedTime;
}
To hold the results I’ve used map of maps:
class Results
{
public:
    std::map<std::string, std::map<int, double>> _res;
};
This map stores for each test case (its name), a map of number of ‘N’
and elapsed time for such test run.
So _res["hello"][100] - means elapsed time for test run ‘hello’ with
100 elements.
And the main method:
void Reporter::SaveToFile(const char *fname)
{
    Workbook ^workbook = gcnew Workbook();
    workbook->CreateEmptySheets(2);

    String ^range = "";
    String ^labelRange = "";
    writeData(_results, workbook, range, labelRange);
    createChart(workbook, range, labelRange);
    std::cout << "Workbook with data created!" << std::endl;

    String ^filename = gcnew String(fname);
    workbook->SaveToFile(filename, ExcelVersion::Version2007);
    std::cout << "Workbook written to " << fname << std::endl;
}
The C++CLI code looks almost like C#, but with those funny ^
characters :)
As name suggests writeData and createChart functions writes data to
a spreadsheet (fills the rows) and then create a chart out of this data.
In the above example I’ve profit from Spire.XLS library. This is very handy and easy to use module. I’ve used the free version (max 150 rows per file) - but this is enough for most of my cases.
Basically the library lets you manage XLS files without having Office installed in your system. Additionally, I had no problems with adding references in Visual Studio 2013 Express and even in C++ CLI. Of course, it will work flawlessly with .NET Framework (any above 2.0)
The output
Actually my output from native/managed example is the same as in my original article. But, that was my purpose! :)
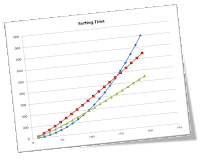
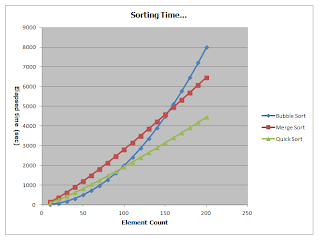
Spire.XLS library created a file, wrote some rows, formed a chart and saved it successfully to disk. Of course, the test results now comes from native, not managed, code!
Summary
In the above example I’ve shown how easily output test results from native code into a worksheet file. Spire.XLS< library makes our life very easy and with several lines of code you can create a file, chart perform calculation.
For a simple test case this might be optional, but when you develop a bigger project such automation will save you a lot of time.
Resources
What do you think about this design?
Do you know any other library that can help with such automation?
What method do you use to output test results from your experiments?
I've prepared a valuable bonus for you!
Learn all major features of recent C++ Standards on my Reference Cards!
Check it out here:


