Last Update:
11 Debugging Tips That Will Save Your Time

Table of Contents
Programming is not only typing the code and happily see how smoothly it runs. Often it doesn’t run in a way we imagine! Thus, it’s crucial to debug apps effectively. And, it appears that the debugging is an art on its own! Here’s my list of tips that hopefully could help in debugging native code.
**Node:**The tips located here were extended, improved and published on Visual Studio Magazine, read more here.
Helpers
Everyone should know how to start the debugger, set a breakpoint, continue code execution, step in, step out (using keyboard!). Here are some smaller tips that are just extend the basic actions.
1. Add LinePos to your debug output
No matter how proficient you are, I think, you will still use one of the basic methods: trace some values using printf, TRACE, outputDebugString, etc… and scan the output while debugging. In Visual Studio there’s a nice trick that allows you to quickly move from the debug output window to the particular line of code.
Just use the following syntax for the output format:
"%s(%d): %s", file, line, message
But remember to use file and line from the actual position in the
source file, not in some logging function. Thus you should probably have
a macro like that:
#define MY_TRACE(msg, ...) MyTrace(__LINE__, __FILE__, msg, __VA_ARGS__)

// usage:
MY_TRACE("hello world %d", 5);
Note that __LINE__ and __FILE__ are common, ANSI-Compliant,
preprocessor defines that are available to your compiler. See
Predefined Macros,
MSDN
One more thing: remember to use OutputDebugString so that the message
goes into Output Window, not console…
When a particular message goes to the VS output window, you can now double click on the message and VS will move you to that file and line. Same happens for viewing warnings or errors during compilation. I’ve lost a lot of time when I saw a message but I couldn’t know the exact place in the code. In that case I needed to search for the string… that is slow and not effective. With double-click it’s a matter of milisec to be in the proper destination.
BTW: If you use other IDE (other than Visual Studio) do you know if they support similar double-click feature? Let me know, because I am curious.
Here is some simple sample you can play: github.com/fenbf/DebuggingTipsSamples
Update: as
jgalowicz
mentioned in the comments. If you really like to have only short
filenames in the output you can play with his __SHORT_FILE__
technique: see here on his
blog..
Still, by default Visual Studio uses /FC compiler
option off by
default, so you usually have short filenames (probably relative to your
solution dir only)
2. Simple static variable to control the feature
// change while debugging if needed
static bool bEnableMyNewFeature = true;
Edit And Continue in Visual studio is really powerful feature, but here’s a simplified , ‘manual ’ version. Probably not that beautiful, but works. Just make a static variable that can be used to control a feature. Could be just a boolean flag, or an integer. Then, while debugging you can actually change that value. Without the need to restart the program or recompile you can play with your feature.
How to change the value during debugging? Go to the watch window or just hover on top of the variable. You should see an edit box where the value can be changed.
Please remember to disable/remove that ugly variable in the final builds and commits!
3. Conditional breakpoints
I hope you use conditional breakpoints already, but let me just quickly show their basic uses. As name suggests you can set a condition, relatively simple one, upon which a debugger will stop.

One hint: write a custom breakpoint if you need more advanced test.
Here the list of expressions you can use in conditions: msdn: Expressions in the Debugger
That’s not all.
As you might notice on the above screen shot, there is also one helpful breakpoint condition: “Hit count”. You can specify after what number of events a breakpoint will really happen. Very handy if you trace some dynamic event or lots of objects.
4. Don’t step into unwanted functions
How many times have you stepped into a constructor for a string type and then needed to quickly step out? Or when you needed to step into lots of small/library functions before the target method? In most cases it’s a waste of time.
See the following example:
void MyFunc(const string &one, const string &two)
{
    auto res = one + two;
    std::cout << res << "\n";
}
/// ...
MyFunc("Hello ", "World");
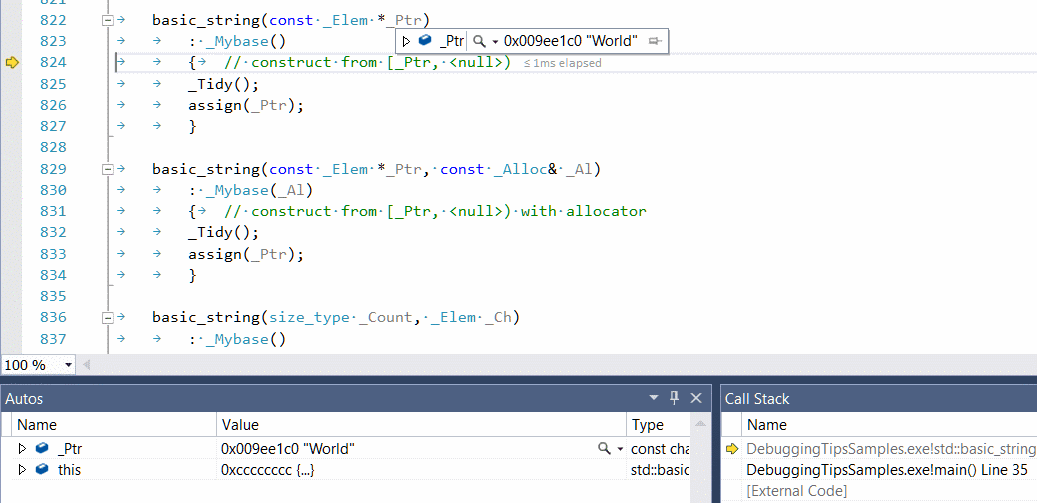
And then try to press Ctrl+F11 to step into the call of MyFunc().
Where will the debugger go? I see something like this:

What’s more, if you step out of this and then step into again… you’ll go into the second param constructor. Imagine what happens if you have several parameters. You can be easily frustrated before going into your target method!
In most cases it’s better to just filter out those unwanted methods.
It’s very rare the problem you’re trying to catch is in the
std::string constructor :)
What to do to filter those basic functions out?
Since VS 2012 there is a simple method to create filters: you need to
edit default.natstepfilter
Read here about the method of filtering before VS 2012: How to Not Step Into Functions using the Visual C++ Debugger. In older versions you have to play with registry values most of the time.
Cool stuff:
As a little incentive, the same functionality is greatly simplified in
Visual Assist. While Debugging you see VA Step
Filter.
You can just click on the check box to enable or disable filter for a
discovered method. That setting can be global or just for a given
project. VA filter setting are custom solution, they don’t merge with
default.natstepfilter file.
You can download the trial and have a quick look: Download a free trial.
5. Add helper variables for your objects in debug mode
More data is better then less data! It’s always possible to filter out unwanted messages, but it’s impossible to create data out of nothing. Depending on what you’re doing it might be useful to add some additional variables into your objects. When you’re debugging that variables might bring very important information or just make your life easier.
For example, when you work on Tree structures you’ll probably often need
to check pNext, pPrev elements. Often those pointers are placed in
some base class like a TreeNode, and if you’re checking MyTreeNode
that is three levels of class hierarchy lower it’s a pain to check
pNext every time. What if you’ll update MyTreeNode with some
additional data from pNext? Then you can easily check that without
going through object hierarchies. One disadvantage: how to maintain that
additional state? 'pNext might be easily changed, so you would have to
make some additional logic to properly sync that. While that’s true in
most cases, maybe for debugging you don’t need to have full and perfect
solution?
Let me give you an example.
I often work on Tree structures that represents text object. Text object
contains lines, and lines contains characters. It was painful to check
in what line am I in - what text it contains. Because I had to get the
first char from the line, then get the pNext and then I ‘see’ the
first two letters of the line so I have a clue what line I’m in. How to
make that process a bit easier? I’ve just made strLine and added that
to Line. I’m updating that new member from time to time. This might
not be a perfect information (it might miss when a letter is added or
deleted in one frame, but it would get that info in the next frame).
But at least I can quickly get the idea in what text line I am in.
Simple and easy! And saves a lot of time.
6. Write custom debugging visualizers
This is a huge topic that I’d just like to introduce:
If you’re unhappy about the view of your objects in the debugger, you
might want to write your own visualisers.
Debug Visualizers in Visual C++ 2015
In VS2015 there’s even a new built-in template which can be found under Project->Add New Item->Visual C++->Utility->Debugger visualization file (.natvis)
Techniques
With the basic tools we can compose some more advanced strategies.
7. Lots of objects to investigate?
When you have code that is called for lots of objects it’s hard to go through all the objects and just check them line by line. Think about a unique value that might lead you to the interesting place in the code. Then you can set a conditional break and set condition that catches some range. The smaller the range the better.
For example: often I had to debug code that goes through all the
characters in a document. One (special) character was not doing ‘well’.
It would be impossible to debug all those character individually. But I
knew that this special character has different bounding box size than
other letters. So I set a conditional breakpoint and looked for ‘width’
value that might point to my special character
(width > usual_char_width). I got only two or three elements to check,
so I could quickly investigate what was wrong.
In general, you want to make your available options as narrow as possible so that you have only several (not tens or hundreds) places to debug.
8. Mouse events
Debugging mouse events is especially confusing, because when debugger stops the code, most of the events go away!
Mouse clicks are usually easy: for example if you want to check what code was invoked after mouse clicked on some object. Just break into some OnClick/onMouseDown method.
What about mouse dragging? If the debugger stops then the drag state is lost. In those situations I try to do the following things:
- Use good old trace/printf output. While dragging I get a lot of messages that leads to better understanding what’s going on. Without breaking the execution. Probably you want to have short drags operations, otherwise you’ll end up with tons of output to filter. Using that output you can isolate the most important place and focus on that part later.
- Use conditional breakpoints in places that you really want to check.
For example you rotate the object, and you’ll interested why it
unexpectedly change position. You can set a breakpoint on the
position members and you’ll get a chance to see what’s going on
there. The state after stopping is lost, but at least you could play
with the rotation for a while and you get into the potential place
in the code. Another idea is to set the condition when
obj_rot > some_meaningful_value. - Dragging often happens on a copy of objects. Then after the dragging the real objects are transformed once into the proper state. Maybe you can set breakpoint to look only on the original objects? Maybe there is a separate state in the app that tells this is drag operation happening? Then the debugger will stop at the end of drag operation.
9. Build debug visualizers, tools
This might be an evolution of introducing just a simple variables for debugging. If you’re working with complex object, it’s worthy to have tools that trace the data better. Visual Studio or any other IDE/debugger will help you with general stuff, but since each project is different, it’s useful to have custom solutions.
In games that’s very often situation as I see. You probably have some layer that can be enabled during the game session, it will show game stats, performance data, memory consumption. That can be improved to show more and more stuff - depending on your needs. So I definitely suggest investing in those tools.
Other
10. Debug the Release Build
Release builds are faster because most of the optimizations are enabled. However there is no reason why you couldn’t debug such code. What to do to enable such debugging? It needs the following steps: in VS 2013 and VS 2015:
- Set Debug Information Format to C7 compatible (/Z7) or Program Database (/Zi).
- Set Enable Incremental Linking to No
- Set Generate Debug Info to Yes
- Set References to /OPT:REF and Enable COMDAT Folding to /OPT:ICF
11. Speed up debug builds!
- Slow debug:
Tools->Options->Debugging->General->”Require source files to exactly match the original version”
Found at http://www.codeproject.com/Tips/515168/Overlooked-reason-for-debug-step-slow-down-in-Visu - Disable Debug Heap - before VS 2015
You can read about debug heap in my older article: Visual Studio slow debugging and _NO_DEBUG_HEAP. Fortunately in VS2015 this heap is disabled by default, so you shouldn’t be expiriencing those problems. - Control symbol files loading. You can reduce number of loaded symbol files, so the startup will be faster. Read more here: Understanding symbol files and Visual Studio’s symbol settings
Summary
In the article I covered 11 tips that will speed up debugging process.
What are the most important items for me? Probably that would be
conditional breakpoints, debugging lots of objects and improvements in
the debug version of the code. But other elements from the list are also
important, so it’s not easy to make a real order here. And often you
have to exchange one technique into another one, to suit your needs
best.
What’s more, the list is definitely not complete, and many more
techniques exists. Maybe you have something to add?
- Do you use any special techniques when you debug your apps?
- Do you use any custom tools to help debugging?
Resources
I've prepared a valuable bonus for you!
Learn all major features of recent C++ Standards on my Reference Cards!
Check it out here:

