Last Update:
Vector of Objects vs Vector of Pointers

Table of Contents
Memory access patterns are one of the key factors for writing efficient code that runs over large data sets. In this blog post, you’ll see why there might be a perf difference of almost 2.5x (in both directions!) when working with a vector of pointers versus a vector of value types.
Let’s jump in.
Use Cases
Let’s compare the following cases:
std::vector<Object>std::vector<std::shared_ptr<Object>>std::vector<std::unique_ptr<Object>>
For this blog post, let’s assume that Object is just a regular class, without any virtual methods.
With pointers to a base class and also with virtual methods you can achieve runtime polymorphism, but that’s a story for some other experiment. For example, we can try std::variant against regular runtime polymorphism…
Ok, so what are the differences between each collection? Let’s make a comparison:
std::vector<Object>
The memory is allocated on the heap but vector guarantees that the mem block is continuous.

On the diagram above, you can see that all elements of the vector are next to each other in the memory block.
std::vector<std::unique_ptr<Object>>
This time each element is a pointer to a memory block allocated in a possibly different place in RAM. We use unique_ptr so that we have clear ownership of resources while having almost zero overhead over raw pointers.
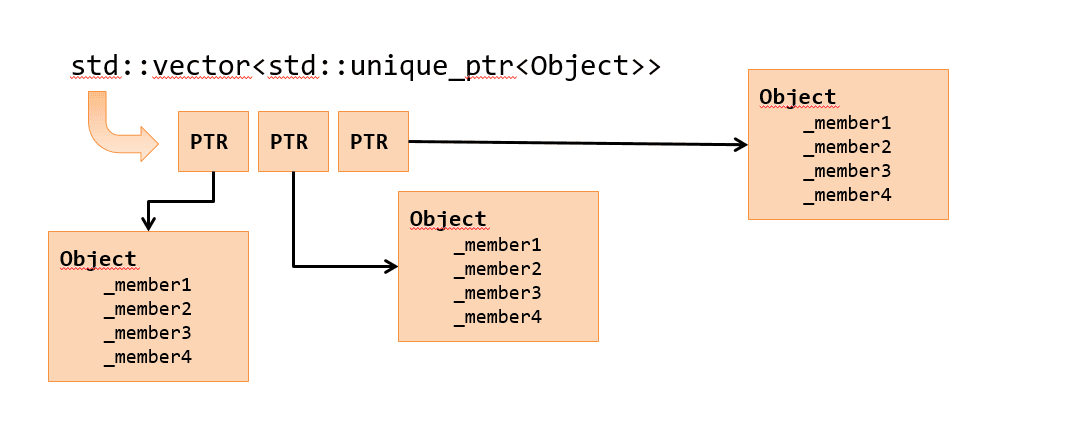
If we use default deleter or stateless deleter, then there’s no extra memory use. You can read more in a separate blog post: Custom Deleters for C++ Smart Pointers
std::vector<std::shared_ptr<Object>>
With shared_ptr we have a collection of pointers that can be owned by multiple pointers. This can simulate, for example, references in C#.
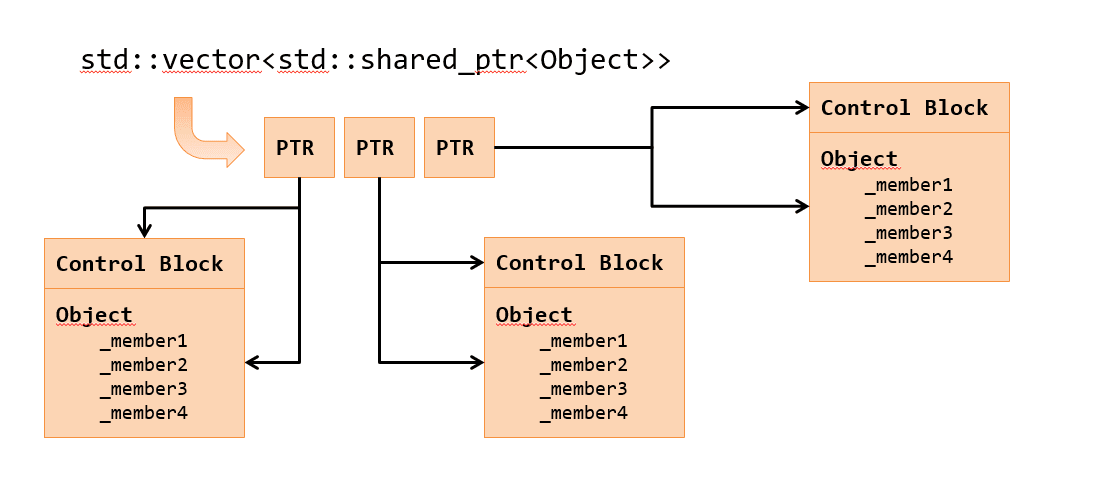
This time, however, we have a little more overhead compared to the case with unique_ptr. To support reference counting the shared pointer needs to have a separate control block. Inside the block, there is a place to store the reference counter, the “weak” counter and also the deleter object.
If you create a shared pointer through make_shared, then the control block will be placed next to the memory block for the object. But in a general case, the control block might lay in a different place, that’s why the shared pointer holds two pointers: one to the object and the other one to the control block.
The Test Code
Full repository can be found here: github/fenbf/PointerAccessTest but the code is also tested with Quick Bench:
- Benchmark for the
update()method: @QuickBench - Benchmark for
std::sort: @QuickBench
There’s also experimental code at https://github.com/fenbf/benchmarkLibsTest where I wrote the same benchmark with a different library: Celero, Google Benchmark, Nonius or Hayai (and see the corresponding blog post: Revisiting An Old Benchmark - Vector of objects or pointers)
Core parts of the benchmark:
- creates a container of objects
- runs generate method - so that we have some random numbers assigned
- runs the
update()method N times - runs
std::sort()N times
The Object class - Particle
To have a useful example for the object class I selected the Particle class which can simulate some physical interactions and implements a basic Euler method:
class Particle {
public:
    float pos[4];
    float acc[4];
    float vel[4];
    float col[4];
    float rot;
    float time;
    //uint8_t extra[EXTRA_BYTES];
public:

    void generate() noexcept {
        acc[0] = randF();
        acc[1] = randF();
        acc[2] = randF();
        acc[3] = randF();
        pos[0] = pos[1] = pos[2] = pos[3] = 0.0f;
        vel[0] = randF();
        vel[1] = randF();
        vel[2] = randF();
        vel[3] = vel[1] + vel[2];
        rot = 0.0f;
        time = 2.0f+randF();
    }

    void update(float dt) noexcept {
        vel[0] += acc[0] * dt;
        vel[1] += acc[1] * dt;
        vel[2] += acc[2] * dt;
        vel[3] += acc[3] * dt;
        pos[0] += vel[0] * dt;
        pos[1] += vel[1] * dt;
        pos[2] += vel[2] * dt;
        pos[3] += vel[3] * dt;
        col[0] = pos[0] * 0.001f;
        col[1] = pos[1] * 0.001f;
        col[2] = pos[2] * 0.001f;
        col[3] = pos[3] * 0.001f;
        rot += vel[3] * dt;
        time -= dt;

        if (time < 0.0f)
            generate();
    }
};
The Particle class holds 72 bytes, and there’s also some extra array for our further tests (commented out for now). The update() method is simple, has only several arithmetic operations and a single branch. This method will be memory-bound as all operations inside are too simple.
Vector of Pointers:
Here’s the code for a vector of unique_ptr, the code is almost the same for a vector of shared_ptr.
static void UniquePtrUpdate(benchmark::State& state) {
  std::vector<std::unique_ptr<Particle>> particles(count);
    for (auto& p : particles)
        p = std::make_unique<Particle>();

  for (auto& p : particles)
            p->generate();

  ShuffleVector(particles);

  // Code inside this loop is measured repeatedly
  for (auto _ : state) {
    for (auto& p : particles)
            p->update(DELTA_TIME);
  }
}
BENCHMARK(UniquePtrUpdate);
And also here’s the code that benchmarks std::sort:
static void SharedPtrSort(benchmark::State& state) {
  std::vector<std::shared_ptr<Particle>> particles(count);
    for (auto& p : particles)
        p = std::make_shared<Particle>();

  for (auto& p : particles)
            p->generate();

  ShuffleVector(particles);

  // Code inside this loop is measured repeatedly
  for (auto _ : state) {
    std::sort(std::begin(particles), std::end(particles),
            [](const std::shared_ptr<Particle>& a, const std::shared_ptr<Particle>& b) {
                return a->pos[0] < b->pos[0];
            }
        );
  }
}
BENCHMARK(SharedPtrSort);
Extra note on subsequent memory allocations
When you allocate hundreds of (smart) pointers one after another, they might end up in memory blocks that are next to each other. This can affect the performance and be totally different than a regular use case when objects are allocated in random order at a random time and then added to a container. To mitigate this issue, the benchmark code adds a randomisation step: ShuffleVector().
Before randomisation, we could get the following pointers’ addresses:
| Address | Diff to the previous element (bytes) |
|---|---|
| 16738564 | 0 |
| 16712876 | -25688 |
| 16712972 | 96 |
| 16768060 | 55088 |
| 16768156 | 96 |
| 16768252 | 96 |
| 16768348 | 96 |
| 16768444 | 96 |
| 16768540 | 96 |
| 16768636 | 96 |
| 16768732 | 96 |
| 16768828 | 96 |
| 16768924 | 96 |
| 16770404 | 1480 |
After randomize:
| Address | Diff to the previous element (bytes) |
|---|---|
| 14772484 | 0 |
| 14832644 | 60160 |
| 14846956 | 14312 |
| 14876972 | 30016 |
| 14802076 | -74896 |
| 14802172 | 96 |
| 14809916 | 7744 |
| 14858572 | 48656 |
| 14875628 | 17056 |
| 14816612 | -59016 |
| 14819756 | 3144 |
| 14822996 | 3240 |
| 14802844 | -20152 |
| 14804612 | 1768 |
The second table shows large distances between neighbour objects. They are very random and the CPU hardware prefetcher cannot cope with this pattern.
Vector of Objects:
Vector of objects is just a regular vector with one call to the update method.
static void ValueUpdate(benchmark::State& state) {
  std::vector<Particle> particles(count);

  for (auto& p : particles)
    p.generate();

  ShuffleVector(particles);

  // Code inside this loop is measured repeatedly
  for (auto _ : state) {
    for (auto& p : particles)
        p.update(DELTA_TIME);
  }
}
BENCHMARK(ValueUpdate);
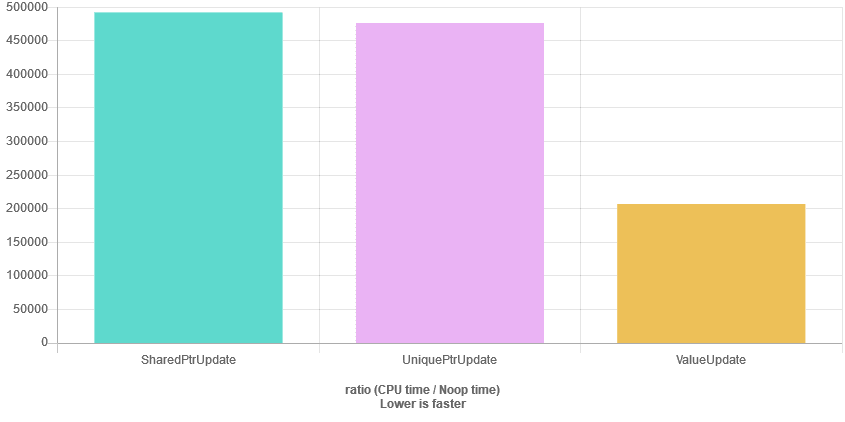
The results for the update() method
Memory Access Patterns
To fully understand why we have such performance discrepancies, we need to talk about memory latency.
Here’s a great summary that explains the problem:
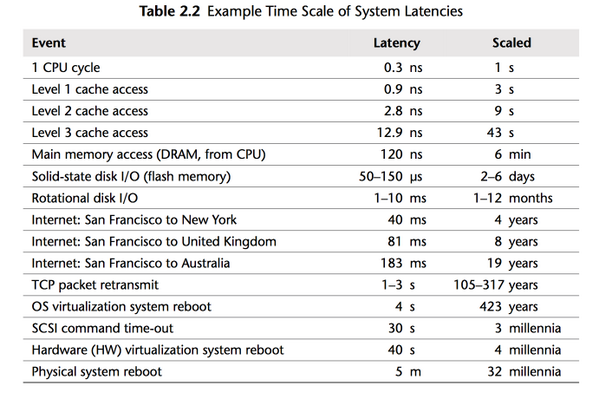
The picture comes from the book: Systems Performance: Enterprise and the Cloud
In the picture, you can see that the closer to the CPU a variable, the faster the memory access is. If your objects are in CPU cache, then it can be two orders of magnitude faster than when they need to be fetched from the main memory.
So, why it is so important to care about iterating over continuous block of memory?
Let us look at out main loop:
for each particle p:
    p->update(DELTA_TIME);
The Continuous Case
- Before we can update any fields of the first particle, it has to be fetched from the main memory into cache/registers. Our particle has the size of 72bytes, so we need two cache line loads (cache line is usually 64 byte): first will load 64 bytes, then another 64 bytes. Notice that only the first 8 bytes from the second load are used for the first particle. The rest - 56b - are the bytes of the second particle.
- In the second step, we have already 56 bytes of the second particle, so we need another load - 64 bytes - to get the rest. This time we also get some data of the third particle.
- And the pattern repeats…
[
For 1000 particles we need 1000*72bytes = 72000 bytes, that means 72000/64 = 1125 cache line loads. In other words, for each particle, we will need 1.125 cache line reads.
But CPUs are quite smart and will additionally use a thing called Hardware Prefetcher. CPU will detect that we operate on one huge memory block and will prefetch some of the cache lines before we even ask. Thus instead of waiting for the memory, it will be already in the cache!
What about the case with a vector of pointers?
The pointer Case
- Load data for the first particle. Two cache line reads.
- Load data for the second particle. Uups… this time we cannot use data loaded in the second cache line read (from the first step), because the second particle data is located somewhere else in the memory! So for the second particle, we need also two loads!
- The patter repeats…
For 1000 particles we need on the average 2000 cache line reads! This is 78% more cache line reads than the first case! Additionally, the hardware Prefetcher cannot figure out the pattern - it is random - so there will be a lot of cache misses and stalls.
In one of our experiments, the pointer code for 80k of particles was more 266% slower than the continuous case.
Results for the sort() benchmark
We can also ask another question: are pointers in a container always a bad thing?
Have a look at the std::sort() case:
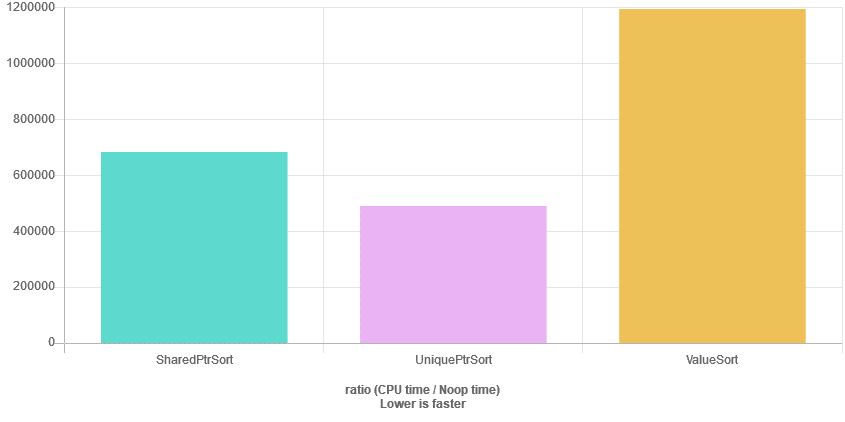
.. ok… what happened there?
As you can see this time, we can see the opposite effect. Having vector of objects is much slower than a vector of pointers.
Here’s another result when the size of a Particle object is increased to 128 bytes (previously it was 72 bytes):
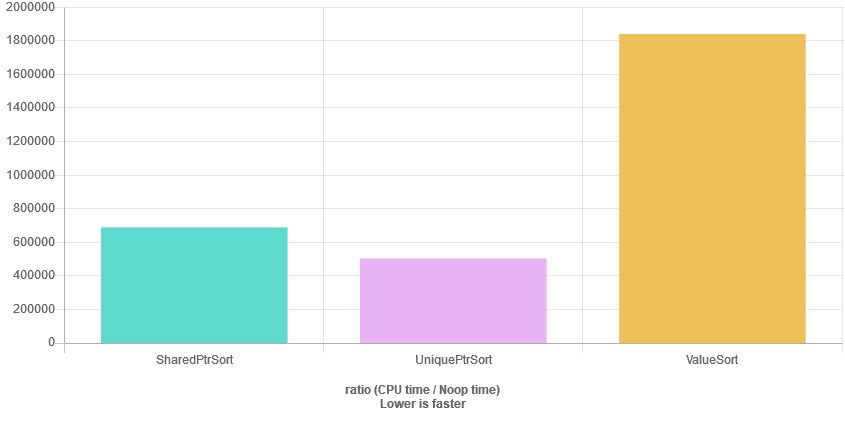
See the benchmark at @QuickBench
The results are because algorithms such as sorting need to move elements inside the container. So they not only read the data but also perform a copy (when the algorithm decides to swap items or move to a correct place according to the order).
Copying pointers is much faster than a copy of a large object.
If you know that copying is a blocker for the elements in the container, then it might be good to even replace the sorting algorithm into selection sort - which has a worse complexity than quicksort, but it has the lowest number of “writes”. So, as usual, it’s best to measure and measure.
Summary
In the article, we’ve done several tests that compared adjacent data structures vs a case with pointers inside a container. Most of the time it’s better to have objects in a single memory block. Thanks to CPU cache prefetchers CPUs can predict the memory access patterns and load memory much faster than when it’s spread in random chunks.
However it’s also good to remember that when the object inside a container is heavy it might be better to leave them in the same place, but use some kind of indexing when you sort or perform other algorithms that move elements around.
And as usual with those kinds of experiments: pleas measure, measure and measure - according to your needs and requirements.
Back to you
Do you try to use memory-efficient data structures? Do you optimise for memory access patterns? Or maybe you have some story to share? Let us know in comments.
You can also have a look and join discussions in those places:
I've prepared a valuable bonus for you!
Learn all major features of recent C++ Standards on my Reference Cards!
Check it out here:

