Last Update:
Micro benchmarking libraries for C++

Table of Contents
After I finished my last post about a performance timer, I got a comment suggesting other libraries - much more powerful than my simple solution. Let’s see what can be found in the area of benchmarking libraries.
Intro
The timer I’ve introduced recently is easy to use, but also returns just the basic information: elapsed time for an execution of some code… What if we need more advanced data and more structured approach of doing benchmarks in the system?
My approach:
timer start = get_time();

// do something
// ...

report_elapsed(start - get_time());
The above code lets you do some basic measurements to find potential hotspots in your application. For example, sometimes I’ve seen bugs like this (document editor app):
BUG_1234: Why is this file loading so long? Please test it and tune the core system that causes this!
To solve the problem you have to find what system is responsible for that unwanted delay. You might use a profiling tool or insert your timer macros here and there.
After the bug is fixed, you might leave such code (in a special profile build setup) and monitor the performance from time to time.
However, the above example might not work in situations where performance is critical: in subsystems that really have to work fast. Monitoring it from time to time might give you even misleading results. For those areas it might be better to implement a microbenchmarking solution.
Microbenchmarking
From wikipedia/benchmark
Component Benchmark / Microbenchmark (type):
- Core routine consists of a relatively small and specific piece of code.
- Measure performance of a computer’s basic components
- May be used for automatic detection of computer’s hardware parameters like number of registers, cache size, memory latency, etc.
Additional answer from SO - What is microbenchmarking?
In other words, microbenchmark is a benchmark of an isolated component, or just a method. Quite similar to unit tests. If you have a critical part of your system, you may want to create such microbenchmarks that execute elements of that system automatically. Every time there is a ‘bump’ in the performance you’ll know that quickly.
I’ve seen that there is a debate over the internet (at least I’ve seen some good questions on SO related to this topic…) whether such microbenchmarking is really important and if it gets valuable results. Nevertheless it’s worth trying or at least it’s good to know what options do we have here.
BTW: here is a link to my question on reddit/cpp regarding micro benchmarking: Do you use microbenchmarks in your apps?
Since it’s a structured approach, there are ready-to-use tools that enables you to add such benchmarks quickly into your code.
I’ve tracked the following libraries:
- Nonius
- Hayai
- Celero
- Google Benchmark( see a separate post: Google benchmark library - C++ Stories) (at the time of writing this blog post, the library wasn’t available on the windows Platform, that’s why I waited a bit and created a separate article)
Test Code
Repo on my github: fenbf/benchmarkLibsTest
To make it simple, I just want to measure execution of the following code:
auto IntToStringConversionTest(int count)
{
    vector<int> inputNumbers(count);
    vector<string> outNumbers;

    iota(begin(inputNumbers), end(inputNumbers), 0);
    for (auto &num : inputNumbers)
        outNumbers.push_back(to_string(num));

    return outNumbers;
}
and the corresponding test for double:
auto DoubleToStringConversionTest(int count)
{
    vector<double> inputNumbers(count);
    vector<string> outNumbers;

    iota(begin(inputNumbers), end(inputNumbers), 0.12345);
    for (auto &num : inputNumbers)
        outNumbers.push_back(to_string(num));

    return outNumbers;
}
The code creates a vector of numbers (int or double), generates numbers from 1 up to count (with some offset for the double type), then converts those numbers into strings and returns the final vector.
BTW: you might wonder why I’ve put auto as the return type for those functions… just to test new C++14 features :) And it looks quite odd, when you type full return type it’s clearer what the method returns and what it does…
Hayai library
Github repo: nickbruun/hayai, Introductory article by the author
Warning: last commit Aug 23, 2019
Library was implemented around the time the author was working on a content distribution network. He often needed to find bottlenecks in the system and profiling become a key thing. At some point, instead of just doing stop-watch benchmarking… he decided to go for something more advanced: a benchmarking framework where the team could test in isolation crucial part of the server code.
Hayai - “fast” in Japanese, is heavily inspired by Google Testing Framework. One advantage: it’s a header only, so you can quickly add it to your project.
Update: After I’ve contacted the author of the library it appears this tools is more powerful than I thought! It’s not documented so we need to dig into the repo to find it :)
A simplest example:
#include <hayai.hpp>

BENCHMARK(MyCoreTests, CoreABCFunction, 10, 100)
{
    myCoreABCFunction();
}
- first param: group name
- second: test name
- third: number of runs
- fourth: number of iterations
In total myCoreABCFunction will be called num_runs x num_iterations. Time is measured for each run. So if your code is small and fast you might increase the number of iterations to get more reliable results.
Or an example from my testing app:
#include "hayai.hpp"

BENCHMARK(ToString, IntConversion100, 10, 100)
{
    IntToStringConversionTest(TEST_NUM_COUNT100);
}

BENCHMARK(ToString, DoubleConversion100, 10, 100)
{
    DoubleToStringConversionTest(TEST_NUM_COUNT100);
}

int main()
{
    // Set up the main runner.
    ::hayai::MainRunner runner;

    // Parse the arguments.
    int result = runner.ParseArgs(argc, argv);
    if (result)
        return result;

    // Execute based on the selected mode.
    return runner.Run();
}
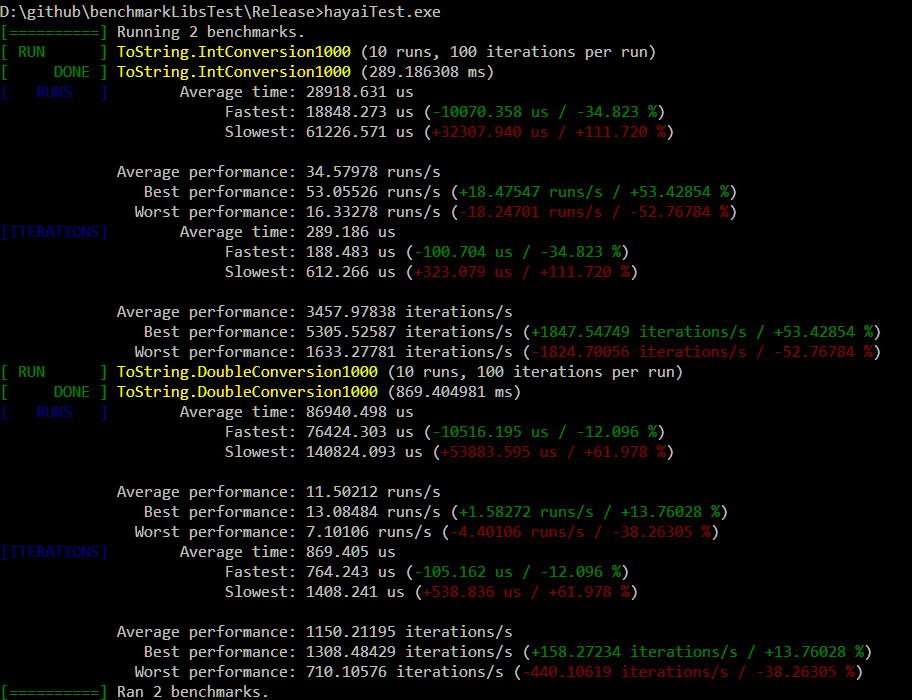
When you run this, we’ll get the following possible results:

As you can see we get average/min/max for runs and also for iterations.
In more advanced scenarios there is an option to use fixtures (with SetUp() and TearDown() virtual methods).
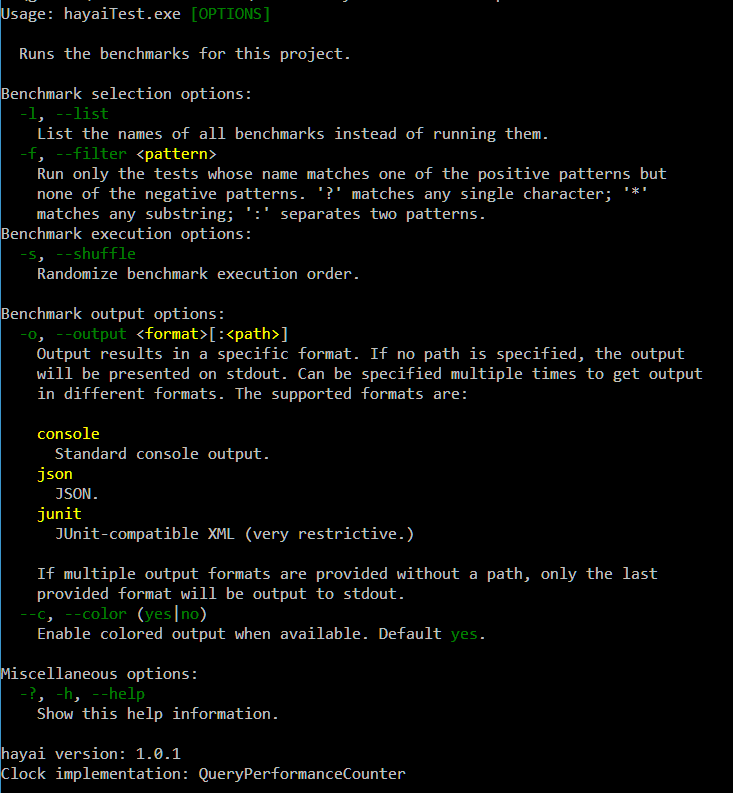
If we run the binary with --help parameter we get the this list of options: 
In terms of output, the library can use only console (correction). It can output to json, junit xml or normal console output. So it’s possible to take the data and analyse it in a separate tool.
Celero library
Github repository: DigitalInBlue/Celero, CodeProject article, Another CodeProject article with examples
Celero goes a bit further and introduces concept of the baseline for the testing code. You should first write your basic solution, then write another benchmarks that might improve (or lower) the performance of the baseline approach. Especially useful when you want to compare between several approaches of a given problem. Celero will compare between all the versions and the baseline.
The library is implemented using the latest C++11 features and it’s not header only. You have to first build a library and link to your project. Fortunately it’s very easy because there is a CMake project. Works in GCC, Clang and VisualStudio and other modern C++ compilers.
Example from my testing app:
#include "celero\Celero.h"
#include "../commonTest.h"

CELERO_MAIN;

BASELINE(IntToStringTest, Baseline10, 10, 100)
{
    IntToStringConversionTest(TEST_NUM_COUNT10);
}

BENCHMARK(IntToStringTest, Baseline1000, 10, 100)
{
    IntToStringConversionTest(TEST_NUM_COUNT1000);
}

BASELINE(DoubleToStringTest, Baseline10, 10, 100)
{
    DoubleToStringConversionTest(TEST_NUM_COUNT10);
}

BENCHMARK(DoubleToStringTest, Baseline1000, 10, 100)
{
    DoubleToStringConversionTest(TEST_NUM_COUNT1000);
}
Similarly to Hayai library, we can specify the group name, test name number of samples (measurements) to take and number of operations (iterations) the the code will be executed.
What’s nice is that when you pass 0 as the number of samples, Celero will figure out the proper number on its own.
The output:

Other powerful features:
- As in other solutions, there is an option to use fixtures in your tests.
- Celero gives you a code
celero::DoNotOptimizeAwaythat can be used to make sure the compiler won’t remove your code from the final binary file. - Celero can automatically run threaded benchmarks.
- There is an option to run benchmark in time limit (not execution number limit), so you can run your benchmark for 1 second for example.
- The library lets you define a problem space: for example when you’re testing an algorithm you can provide several N values and for each N complete set of benchmarks will be executed. This might be useful for doing graphs from your results.
- You can output data to CSV, JUnit xml, or even archive old result file.
Nonius library
The main site - nonius.io, Github repo - rmartinho/nonius
Warning: last commit Sep 29, 2019
Nonius (in fact it’s a name of a astrolabe device) is a library that goes a bit beyond the basic measurements and introduces some more statistics to our results.
One outcome of this idea is that you don’t have to pass number of runs or iterations of your code. The library will figure it out (Celero had some part of that idea implemented, in Hayai there is no such option yet).
Nonius runs your benchmark in the following steps:
- Taking environmental probe: like timer resolution. This doesn’t need to be executed for each benchmark.
- Warm up and estimation: your code is run several times to estimate how many times it should be finally executed.
- The main code execution: benchmark code is executed number of times (taken from the step 2) and then samples are computed.
- Magic happens: bootstapping is run over the collected samples
The library uses modern C++ and is header only. I had no problem in adding this to my sample project. Maybe there was one additional step: you need to have boost installed somewhere, because the library depends on it. Nonius uses std::chrono internally, but if you cannot rely on it (for example because you’re using VS2013 which has a bug in the implementation of std::chrono) then you might define NONIUS_USE_BOOST_CHRONO and then it will use Boost libraries.
Example from my testing app:
#define NONIUS_RUNNER
#include "nonius.h++"
#include "../commonTest.h"


NONIUS_BENCHMARK("IntToStringTest1000", []
{
    IntToStringConversionTest(TEST_NUM_COUNT1000);
})

{
    DoubleToStringConversionTest(TEST_NUM_COUNT1000);
})
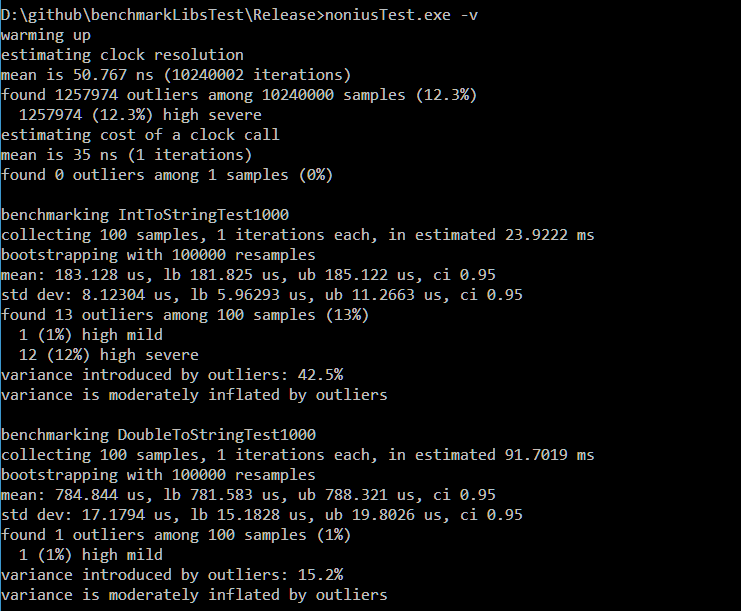
we get the following output:

Here we have to read the output more carefully.
I’ve mentioned that after the data is collected bootstrapping is executed, so we get a bit more detailed results:
- there is a mean, upper bound and lower bound of the samples standard deviation
- outliers: samples that are too far from the mean and they may disturb the final results.
As you can see you get a very interesting data! If, for example, some unexpected job was running (a video player, power saving mode, …) during the benchmark execution you should caught it because outliers will point that the results are probably invalid or heavily disturbed.
By specifying -r html -o results.html we can get a nice graph (as one HTML page):

Other features:
- Fixtures can be used
- if the benchmark consists of one function call like
myCompute()you can just writereturn myCompute()and the library guarantees that the code won’t be optimized and removed. nonius::chronometer meterinput parameter that can be used to perform more advanced tests.- there is a method to separate construction and destruction code from the actual code:
nonius::storage_for<T>
Google Benchmark library
Windows Build not ready - https://github.com/google/benchmark/issues/7
https://github.com/google/benchmark
Windows build is ready!
Read my description about the library here under my new post Google Benchmark Library
Comparison:
Date of update: 12th July 2023
| feature | Nonius | google/benchmark* | Hayai | Celero |
|---|---|---|---|---|
| Latest update | Sep 29, 2019 | Jul 11, 2023 | Aug 23, 2019 | Dec 26, 2022 |
| Header only | Yes | No | Yes | No |
| Dependencies | Boost & STL | just STL | just STL | just STL |
| Fixtures | Yes | Yes | Yes | Yes |
| Stats | runs bootstrapping | simple | simple | compare against the baseline, can evaluate number of runs, more… |
| Output | console, csv, junit xml, html | console, csv, json | console, json, junit xml | console, csv, junit xml |
| Notes | helps in testing creation and destruction, | easy to pass different params to tests, multithreaded | benchmark filtering, shuffling | can execute test with time limit, threaded tests, problem space… |
Summary
In this article I went through three libraries that lets you create and execute micro benchmarks. All of those libraries are relatively easy to add into your project (especially Hayai and Nonius which are header only). To use Celero you just have to link to its lib.
Hayai seems to be the simplest solution out of those three. It’s very easy to understand and but you get a decent set of functionality: console, junit xml or json output, benchmarks randomization order, benchmark filtering.
Celero has lots of features, probably I didn’t cover all of them in this short report. This library seems to be the most advanced one. It uses Baselines for the benchmarks. Although the library is very powerful it’s relatively easy to use and you can gradually use some more complex features of it.
Nonius is probably the nicest. If offers powerful statistic tools that are used to analyse samples, so it seems it should give you the most accurate results. I was also impressed by the number of output formats: even html graph form.
Read about more advanced tests in my next post: Revisiting An Old Benchmark - Vector of objects or pointers
Your turn
- Are you using described benchmarking libraries? In what parts of the application?
- Do you know any other? or maybe you’re using a home grown solution?
- Or maybe micro benchmarking is pointless?
I've prepared a valuable bonus for you!
Learn all major features of recent C++ Standards on my Reference Cards!
Check it out here:

