Last Update:
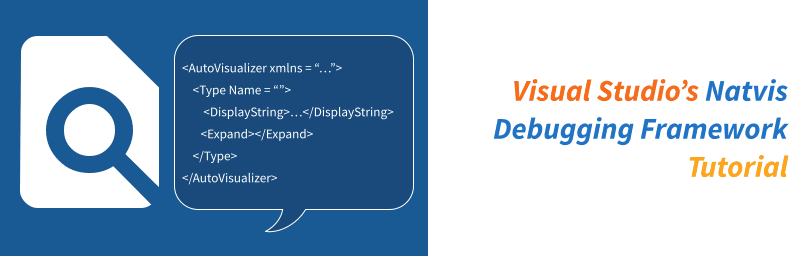
Visual Studio's Natvis Debugging Framework Tutorial
Last time in A Debugging Tip: Write Custom Visualizers in Visual Studio, I introduced the Visual Studio’s Natvis Framework and showed you a couple of samples. That article was just a basic introduction, and now it’s time to see more experiments.
Learn From Existing Code
First of all, we can examine existing code that is shipped with Visual Studio and see how it works.
Here are the directories where you can find *.natvis files:
C:\Program Files (x86)\Microsoft Visual Studio\2017\Community\Common7\Packages\Debugger\Visualizers- for Visual studio 2017C:\Program Files (x86)\Microsoft Visual Studio\2019\Community\Common7\Packages\Debugger\Visualizers- for Visual studio 2019
Let’s look at a few examples from stl.natvis - they represent visualisers for many STL types.
The first one std::pair:
<Type Name="std::pair<*>">
<DisplayString IncludeView="noparens">{first}, {second}</DisplayString>
<DisplayString ExcludeView="noparens">({first}, {second})</DisplayString>
<Expand>
<Item Name="first">first</Item>
<Item Name="second">second</Item>
</Expand>
</Type>
And this the screenshot from a debugging session with two std::pair objects:

By default, you’ll see the short description coming from the DisplayString attribute. And then there’s Expand node with details. Additionally, for all types, there’s [Raw View].
In the watch window, you can specify (rename the expression) and add view(noparens), and then our secondpair variable is displayed without brackets. This is an alternate view that you can provide with IncludeView="noparens" and ExcludeView="noparens" attributes.
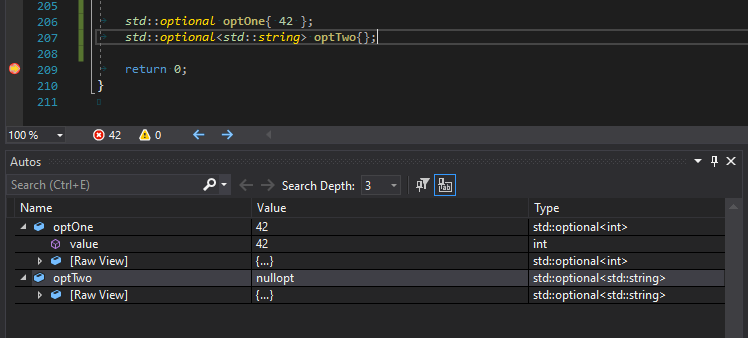
Another one for std::optional:
<Type Name="std::optional<*>">
<Intrinsic Name="has_value" Expression="_Has_value"/>
<Intrinsic Name="value" Expression="_Value"/>
<DisplayString Condition="!has_value()">nullopt</DisplayString>
<DisplayString Condition="has_value()">{value()}</DisplayString>
<Expand>
<Item Condition="has_value()" Name="value">value()</Item>
</Expand>
</Type>
This view uses the Condition attribute to check if a given state happens and then presents nullopt if the optional object is empty.
See the view here:
For an exercise have a look at std::variant visualiser, you’ll be surprised by its length :)
And now let’s try with a container, here’s a std::vector view:
<Type Name="std::vector<*>">
<Intrinsic Name="size"
Expression="_Mypair._Myval2._Mylast - _Mypair._Myval2._Myfirst" />
<Intrinsic Name="capacity"
Expression="_Mypair._Myval2._Myend - _Mypair._Myval2._Myfirst" />
<DisplayString>{{ size={size()} }}</DisplayString>
<Expand>
<Item Name="[capacity]" ExcludeView="simple">capacity()</Item>
<Item Name="[allocator]" ExcludeView="simple">_Mypair</Item>
<ArrayItems>
<Size>size()</Size>
<ValuePointer>_Mypair._Myval2._Myfirst</ValuePointer>
</ArrayItems>
</Expand>
</Type>
And here’s the screenshot:
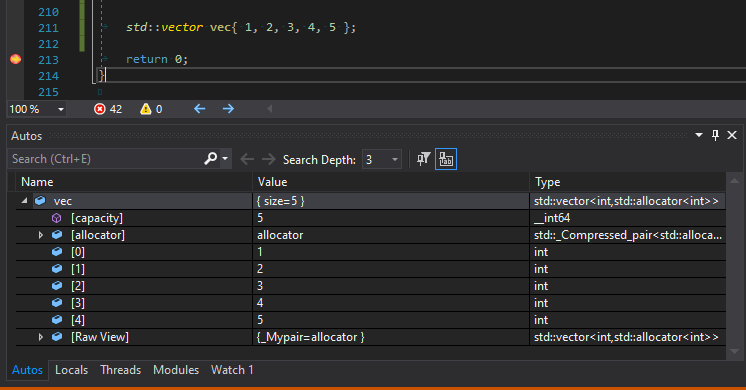
This time it’s a bit more complex, but the most important thing is the ArrayItems node. It allows you to iterate through a collection, and the debugger uses ValuePointer to describe the node’s value. We’ll see that in our custom example later.
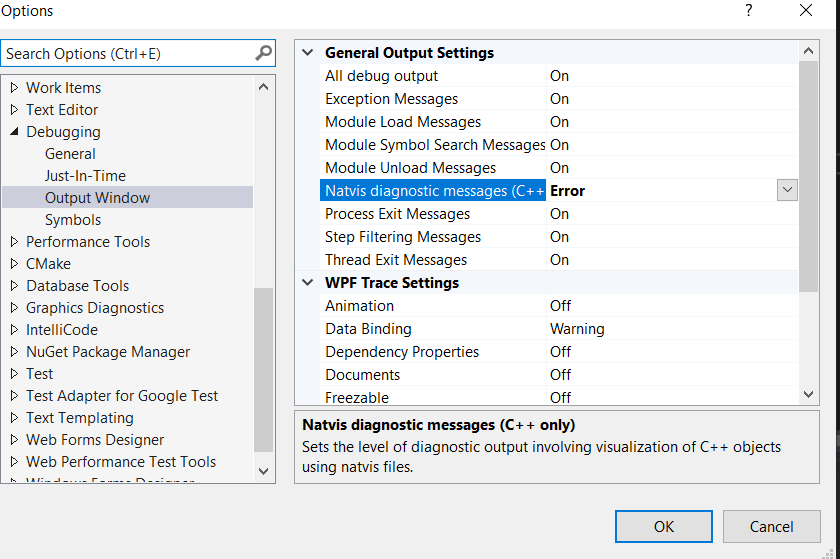
Enable “Debugging” for Debugging
Natvis offers a sort of scripting XML based language, so you cannot really debug it as your regular C++/C# code. When your script is not valid, then the debugger skips it, and you won’t see any results. That might be one indication that something is wrong :)
But to have better experience you can enable diagnostics. Go to Tools -> Options -> Debugging -> Output Window:
Now, to test your new visualiser you can set a breakpoint just before your type appears in a debugging session. Clear the output window (so that it’s easier to spot errors) and then hit F10 to make one step.
For example, I made the following error in my visualiser:
<DisplayString>
String: {mSt,sb}, Integer Value{mVa}, StrLen {strlen(&mStr[0])}
</DisplayString>
mSt should be mStr and mVa should be mVal.
And in the debugging session I see the following output:
Natvis: DebuggingTipsSamples\NatvisFile.natvis(4,29): Error: identifier "mSt" is undefined
Error while evaluating 'mSt,sb' in the context of type 'DebuggingTipsSamples.exe!SimpleParam'.
See here:
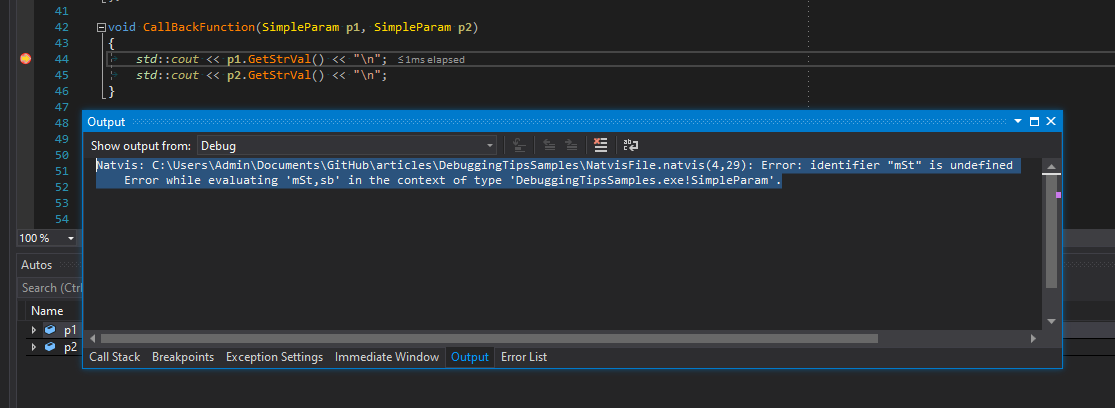
Now it’s much easier to make fixes and run debugging session again.
What’s great is that you can make the changes, save natvis file and then the debugger will automatically reload it and you’ll see changes in the same debugging session.
We’ve seen some predefined visualisers, and we know how to debug them… so it’s time to write our own code.
Exposing Inherited Data
Have a look at this example:
There’s a base class - VertexBase and then its derived class MapVertex. The base class contains a container of neighbour nodes and some generic parameters. The derived type adds name and a range property:
class VertexBase {
public:
    void AddVertex(VertexBase* pVtx) { m_vecNeighbours.push_back(pVtx); }
    virtual bool IsMapVertex() const { return false; }

protected:
    std::vector<VertexBase*> m_vecNeighbours; // observe only
    int m_flags{ 0 };
    double m_weight{ 1.0 };
};
And then the derived class:
class MapVertex : public VertexBase {
public:
    explicit MapVertex(std::string name) : m_name(std::move(name)) { }

    void SetName(const std::string& name) { m_name = name; }
    std::string GetName() const { return m_name; }

    bool IsMapVertex() const override { return true; }

protected:
    double m_range{ 0.0 };
    std::string m_name;
};
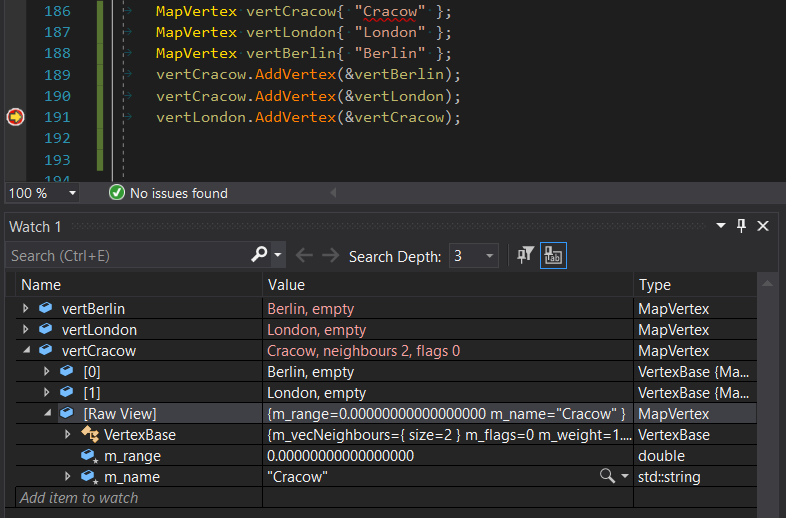
Initially for a simple test code:
MapVertex vertCracow{ "Cracow" };
MapVertex vertLondon{ "London" };
MapVertex vertBerlin{ "Berlin" };
vertCracow.AddVertex(&vertBerlin);
vertCracow.AddVertex(&vertLondon);
vertLondon.AddVertex(&vertCracow);
We have the following output in the debugger watch window:
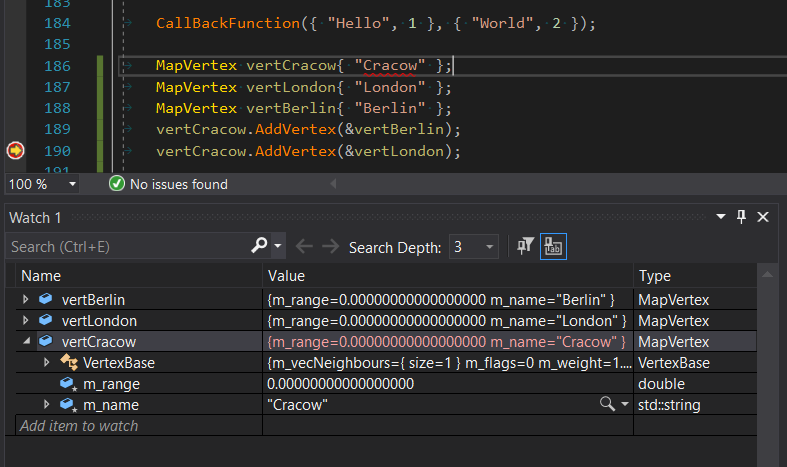
The default view is not too bad, but it’s not easy to see the most interesting elements like the number of neighbours.
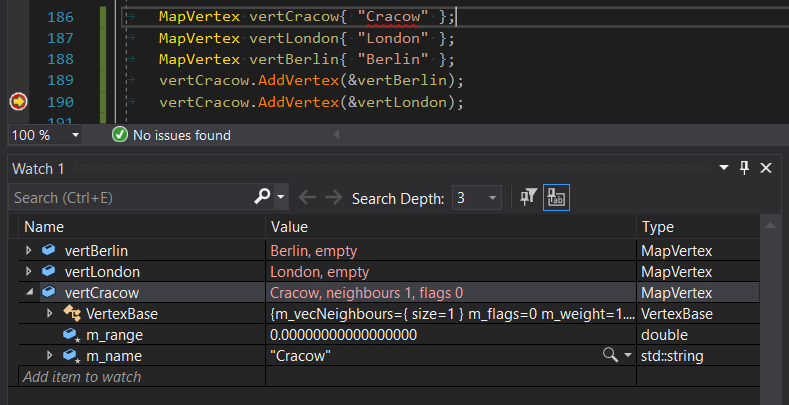
Let’s try with a simple visualiser that can expose what we want, and also we can make a condition for empty vertices:
<Type Name="MapVertex">
<DisplayString Condition="m_vecNeighbours.size() == 0">{m_name,sb}, empty</DisplayString>
<DisplayString Condition="m_vecNeighbours.size() != 0">
  {m_name,sb}, neighbours { m_vecNeighbours.size() }, flags { m_flags }
</DisplayString>
</Type>
And now we can see the following output:
But how about exposing more?
Container-like Types
Our MapVertex is also a container because it stores some additional vertices. Right now, as shown above, we can see the size of that container, but it’s not easy to view items’ values: you have to expand VertexBase to get the content of the base class.
So let’s add the following lines to our visualiser:
<Expand>
  <IndexListItems>
    <Size>m_vecNeighbours.size()</Size>
    <ValueNode>*m_vecNeighbours[$i]</ValueNode>
  </IndexListItems>
</Expand>
And now we can see the following:
Here are the options we can use:
ArrayItems- Use theArrayItemsnode to have the Visual Studio debugger interpret the type as an array and display its individual elements.IndexListItems- You can useArrayItemsexpansion only if the array elements are laid out contiguously in memory. The debugger gets to the next element by simply incrementing its pointer.LinkedListItems- for lists and then we need to specifyHeadPointerNextPointerand size.CustomListItems- you can execute your custom logic for iteration, with some loop and exec nodesTreeItems- for tree-like structures, you can specifyLeftPointerandRightPointerfor tree traversal.
I hope our visualiser is a good start and you can now experiment with your types.
Some Other Links
Natvis:
- For VS Code you can try with this link: The Natvis framework provides custom views for native C++ objects
- Here are the extra routines that can be invoked inside the visualiser, for example
strlen: Expressions in the debugger - Visual Studio | Microsoft Docs - For Eigen library there are predefined visualisers: debug/msvc/eigen.natvis · master · libeigen / eigen · GitLab
- Boost.JSON comes with .natvis visualizers for all of its data structures, so you can inspect all of its types in the debugger and get nice insights: Boost.JSOM @Github (as mentioned in this r/cpp comment)
Other Compilers/Toolchains:
Summary
In this article and in the previous one we discussed the topic of Natvis Debugging Framework. This allows you to write custom views which improve debugging of various complex objects like containers, nested classes or class hierarchies.
The example code can be found in my GitHub repository: github.com/fenbf/articles/DebuggingTipsSamples
- Have you played with this framework?
- What are your debugging techniques when you work with “large” types?
Let us know in comments below the article or join the discussion at this r/cpp thread.
References
- Create custom views of C++ objects - Visual Studio | Microsoft Docs - this is extensive documentation with lots of examples. Highly recommended if you want to write new visualisers.
- Visual C++ Team blog: Debug Visualizers in Visual C++ 2015
I've prepared a valuable bonus for you!
Learn all major features of recent C++ Standards on my Reference Cards!
Check it out here: