Last Update:
A Debugging Tip: Write Custom Visualizers in Visual Studio
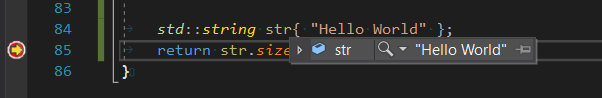
In Visual Studio, when you work with types from the C++ Standard Library or other common APIs, you might be familiar with a concise view of those objects in debugger. You can hover a mouse over an entity, and then the debugger presents short information about their current state. For example:
Sometimes, the default view of objects in the debugger won’t be enough, especially if you operate on complex data structures. Fortunately, there’s a way to alter the view and write custom ones.
Visualizers - Natvis
Before Visual Studio 2012 you could customise your objects’ debugging view by editing autoexp.dat file. It was a bit clumsy to use, though. Both the Automatic expansion of structures and avoid stepping into particular functions were configured using this file. Since VS 2012 we got a new framework called Natvis that uses XML to describe rules for debugging views.
For a simple example, let’s have a look at the following class:
class SimpleParam {
public:
   SimpleParam(std::string str, int val) : mStr(std::move(str)), mVal(val) { }

    // some API

private:
    std::string mStr;
    int mVal{ 0 };
};

// in use:
SimpleParam input{ "number", 42 };
When we hit a breakpoint just after input is created, we might get the following view in Visual Studio 2019:
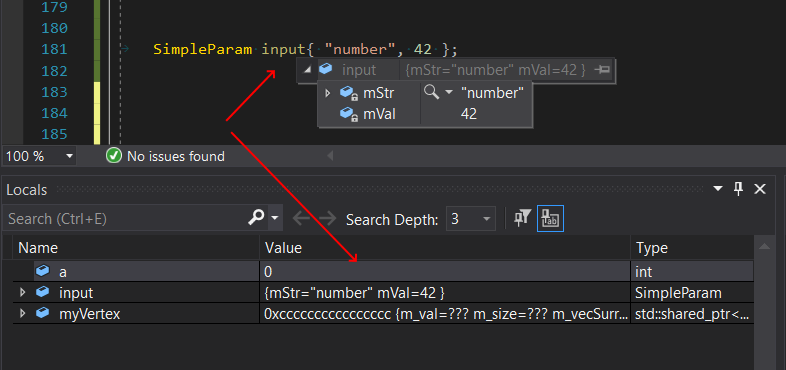
The view is not too bad. We can easily see all data members of input. But with Natvis we can create a custom view of that.
In the solution for the example project, there’s NatvisFile.natvis attached. It’s a per-project configuration for the debugger. Inside there’s the following definition:
<AutoVisualizer xmlns = "...">
    <Type Name = "SimpleParam">
        <DisplayString>String: {mStr, sb}, Integer Value{ mVal }, StrLen{ strlen(&mStr[0]) }</DisplayString>
    <Expand>
        <Item Name = "String">mStr, sb< / Item>
        <Item Name = "Integer Value">mVal< / Item>
        </Expand>
    </Type>
</AutoVisualizer>
What it does is a simple alteration of the view. It will add custom descriptions of the member fields and the string length information.
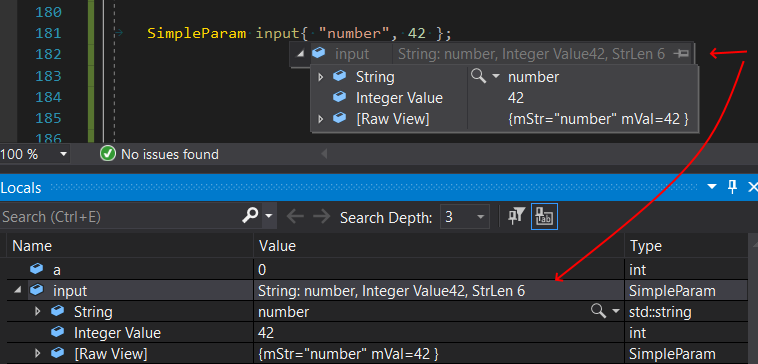
Please note that there’s still [Raw View] option, that displays the default view.
Here are the things you can do with the framework:
- it works on exact types, derived types and even templates
- you can change names, select variables to be shown
- use expressions on variables (but not with side effects), some predefined Debugger intrinsic functions are available (like
strlen) - use conditional expressions to show more/less information
- show arrays, or even multi-dimensional arrays, linked lists structures
- custom logic for traversing the structures
- keep natvis files per project, or load them globally (just put it in something like
C:\Users\Admin\Documents\Visual Studio 2019\Visualizers) - you can see existing views for common STL types by looking at files in the following folder:
C:\Program Files (x86)\Microsoft Visual Studio 12.0\Common7\Packages\Debugger\Visualizers - if the file is attached to a project, then the debugger will dynamically reload it after re-saving (even while debugging!)
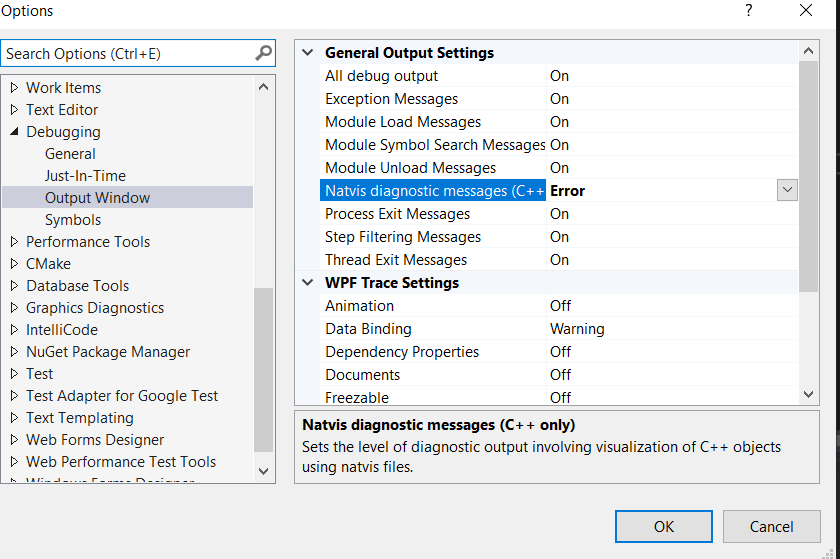
You can also enable diagnostics to see issues with your natvis file:
The example code can be found in my GitHub repository: https://github.com/fenbf/articles/tree/master/DebuggingTipsSamples
Next time I’ll show you how to write a custom visualisation for a class that behaves like a container. Stay tuned!
You Turn
Have you played with the natvis framework? Do you have per-project custom visualisations?
Share your comments and join discussion in this reddit /cpp thread
References
I've prepared a valuable bonus for you!
Learn all major features of recent C++ Standards on my Reference Cards!
Check it out here: